PKT/STK Kinome Analysis
Price per sample (for both PTK and STK): $450.00 (academic) or $500.00 (Industry)
Protein input amount (PTK): 5 ug/array.
Protein input amount (STK): 0.5-2 ug/array.
Sample types: Serum, Plasma, Tissue/Cell Lysates, Other fluids
Species: Human, Murine, Rat, Chicken, Zebrafish, Drosophila, C. elegans, Yeast
With PamGene’s kinase activity profiling platform, the activity of kinases in a wide range of cells and tissues can be measured in real time. We use a proprietary 3D peptide microarray technology (PamChip® and PamStation®) which offers a multiplex method for global kinase activity profiling. The assay is highly sensitive, requiring only a small amount of lysate to measure the activity of kinases in various samples including cell lines, xenografts and human tissues. Lysates obtained from a few thousand cells can suffice to obtain a kinome profile of the multiple kinases present in these samples. This is accomplished by incubating the sample lysates across peptide substrates immobilized on the 3D surface of the PamChip® microarray (196 tyrosine kinase peptides (PTK) or 144 serine/threonine kinase peptides (STK), hereafter referred to as phosphosites). It covers 380+ kinases in 1 full kinome screen. Kinases present in the lysates will phosphorylate the phosphosites, which are visualized using fluorescently labelled antibodies.
PamChip Technology and Assay Principle
PamGene’s microarray assay for kinase activity profiling is based on measuring phosphorylation of phosphosites by protein kinases. The PamChip® 4 consumable consists of 4 identical arrays, each array containing 144 (STK) or 196 (PTK) phosphosites immobilized on a porous ceramic membrane (Figure 1). These phosphosites are encoded in 13 amino acid long peptides which are derived from literature or computational predictions. Fluorescently labelled anti-phospho-antibodies are used to detect phosphorylation activity of kinases present in the sample (Figure 1). The phosphorylation patterns of these phosphosites is then used to computationally predict one or multiple upstream kinases (Protein tyrosine kinases for the PTK PamChip® and Serine threonine kinases for the STK PamChip®).
Assay steps: During the assay, the sample is pumped through the porous membrane, allowing for shorter assay times. When the solution is underneath the array, images of each array are taken at several exposure times by a camera in the workstation (Figure 1). Images are later used by the BioNavigator® software to calculate signal values for each phosphosite. The data workflow consisting of image quantification, quality control, statistical analysis, visualization and interpretation, performed using the BioNavigator® software.
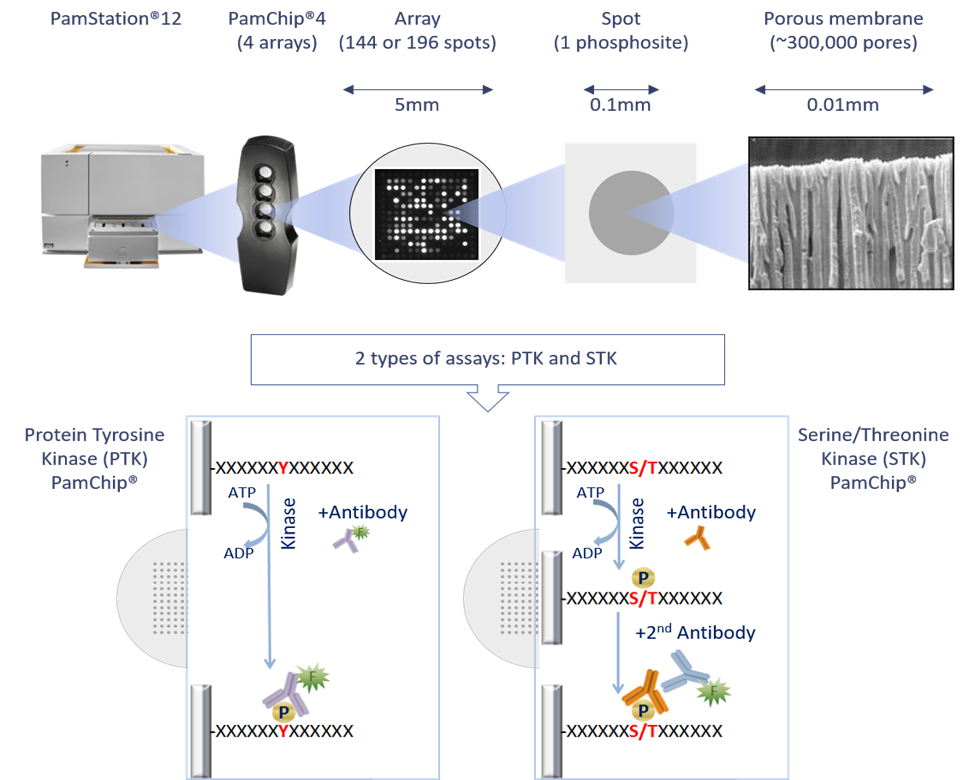
Figure 1: PamGene technology outline and PamChip assay principle.
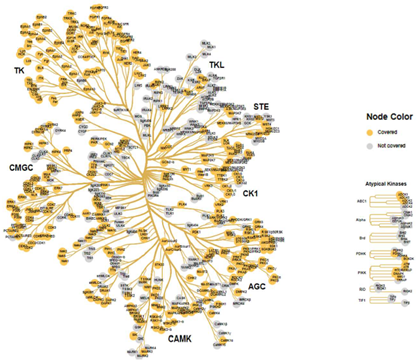
Figure 2: Kinases that are known or predicted to phosphorylate substrate peptides on the PTK and STK PamChip® are mapped from select databases (HPRD, Kinexus, Phosphosite PLUS, Reactome, Phopho.elm, UniPROT) and projected on the kinome tree. It covers >380 Kinases.